Average User Revenue from a Wide Table
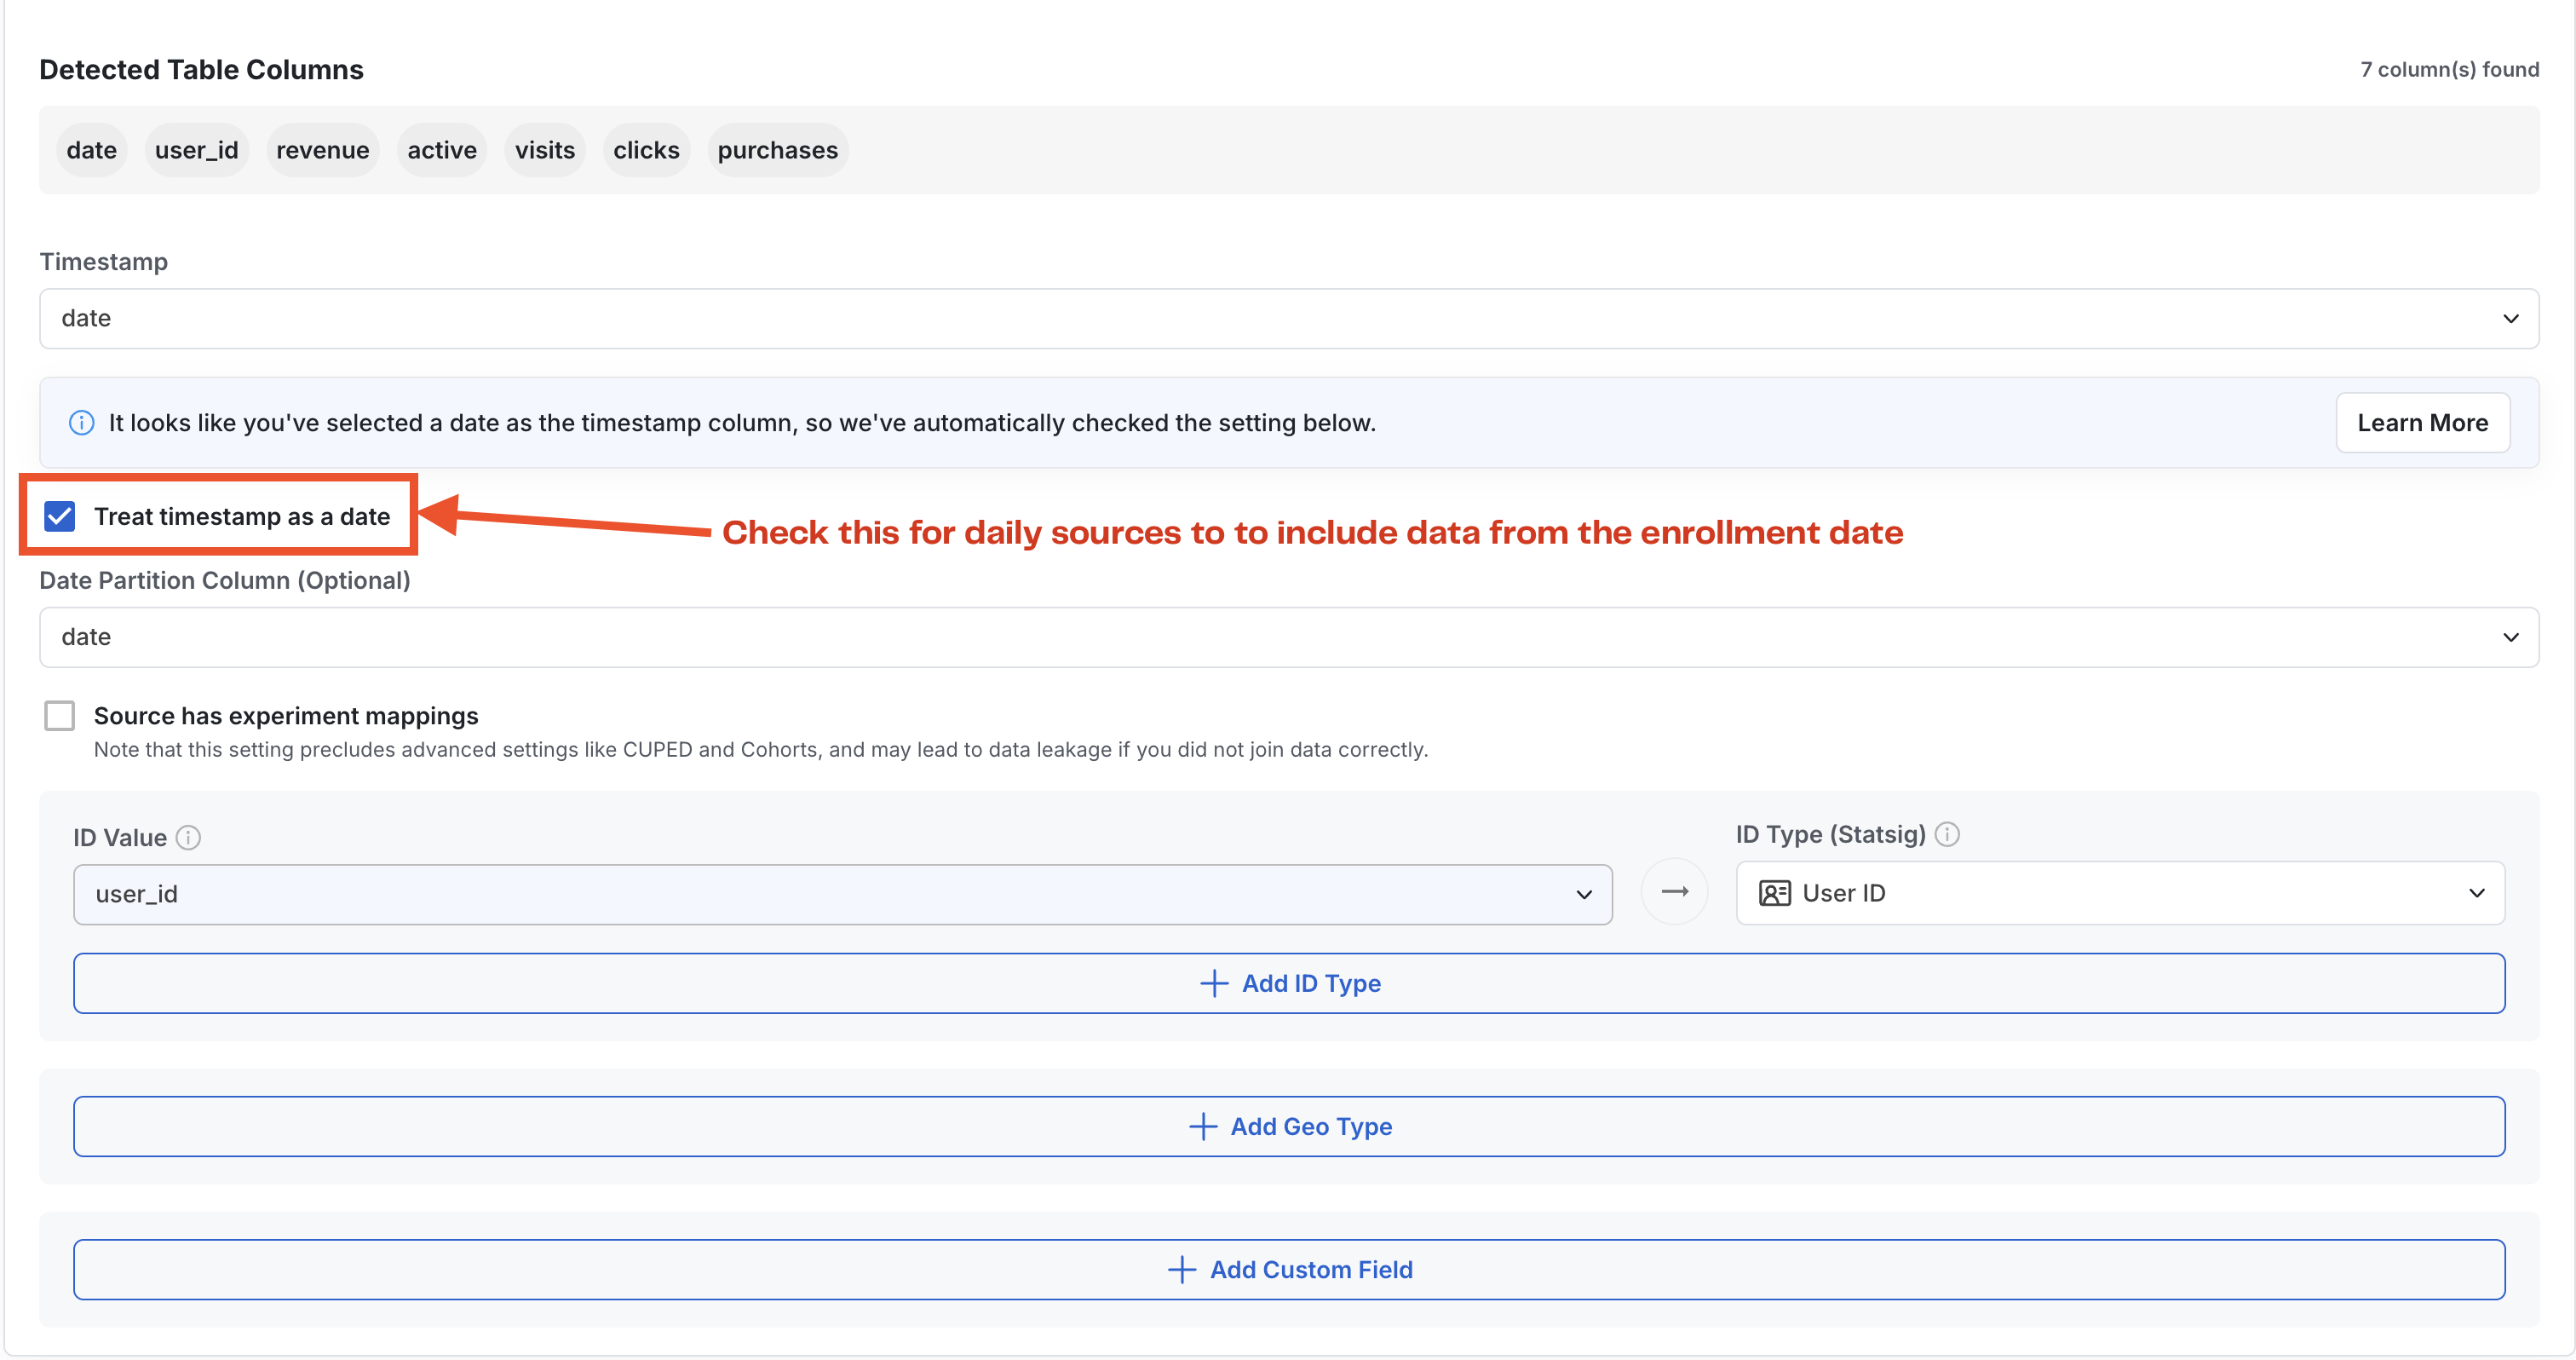
In many cases, companies will have a primary source-of-truth table about user engagement with one row per user-day and many columns representing actions taken or other values. This is very easy to integrate with Statsig. First, enter the table path and optionally a partition column to use for date partitioning: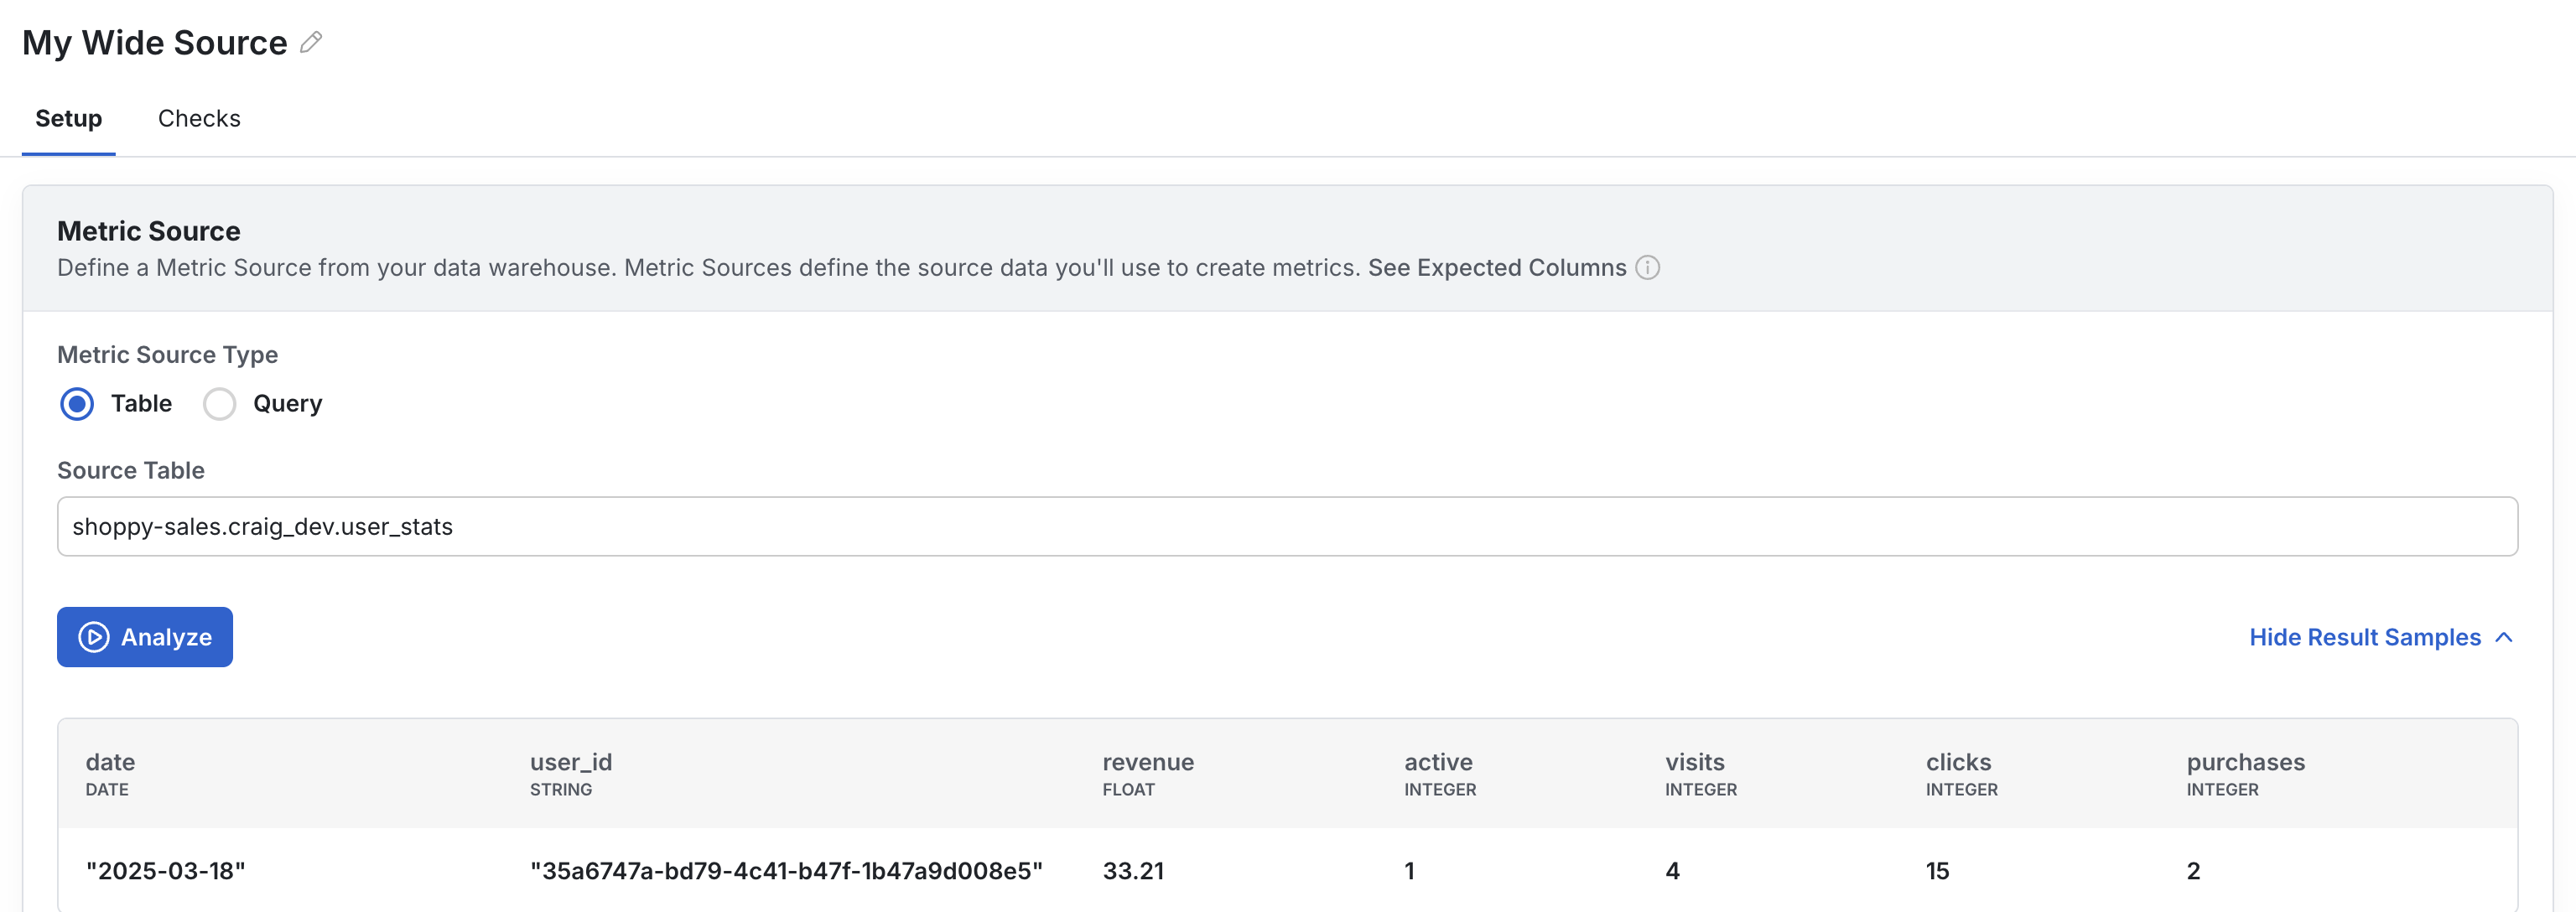
How it works in experiments
First, Statsig aggregates each unit-level record across the days they are enrolled in the experiment. Then, Statsig will calculate the mean unit-level revenue per experiment group, imputing 0s for all exposed users with no revenue. Statsig provides a description of this in-product for any user who wants to learn more:Average Current Account Value
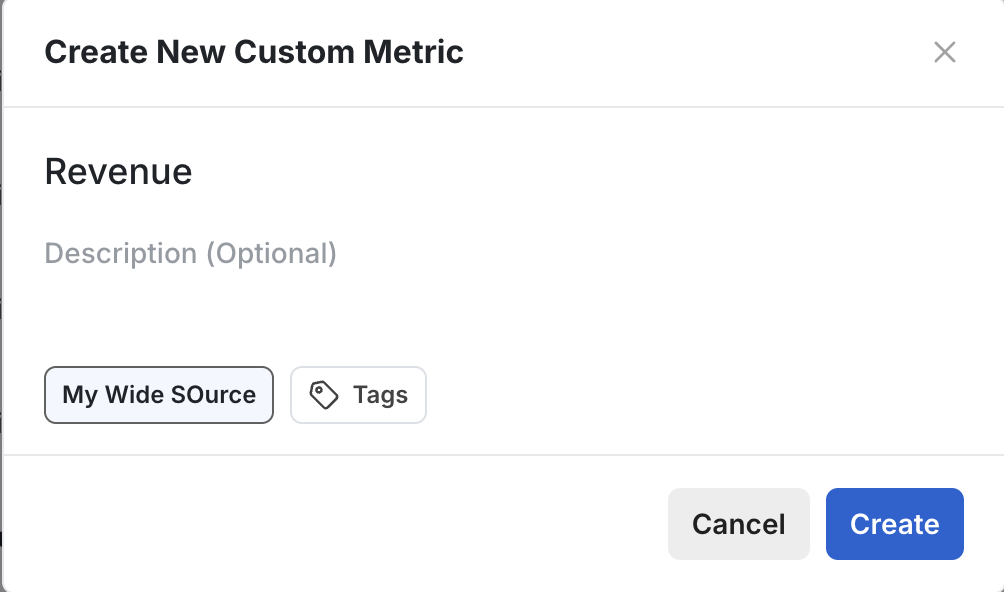
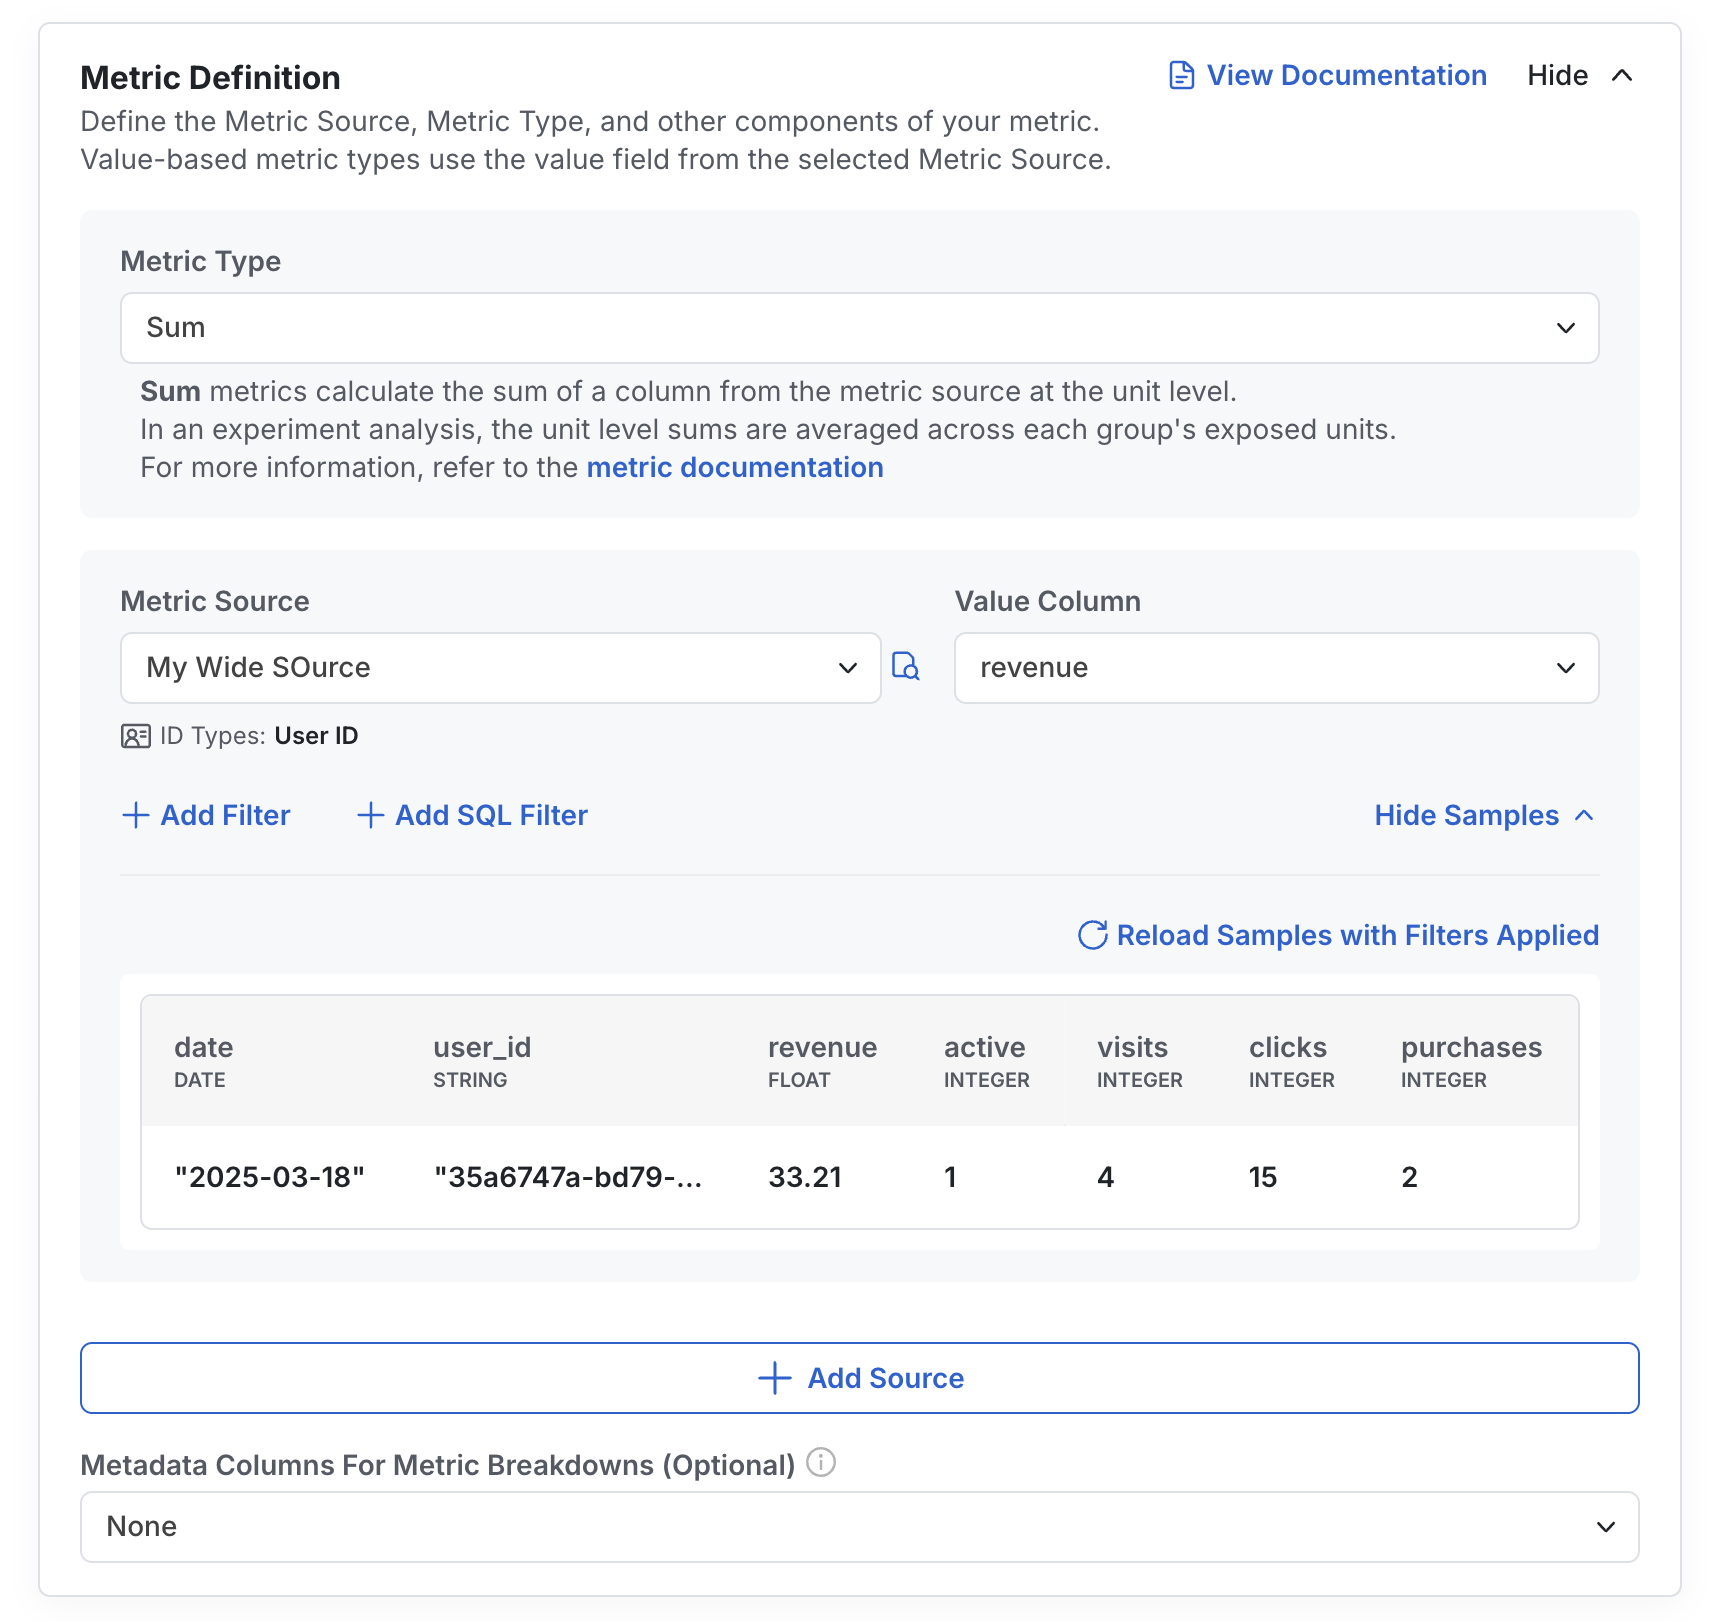
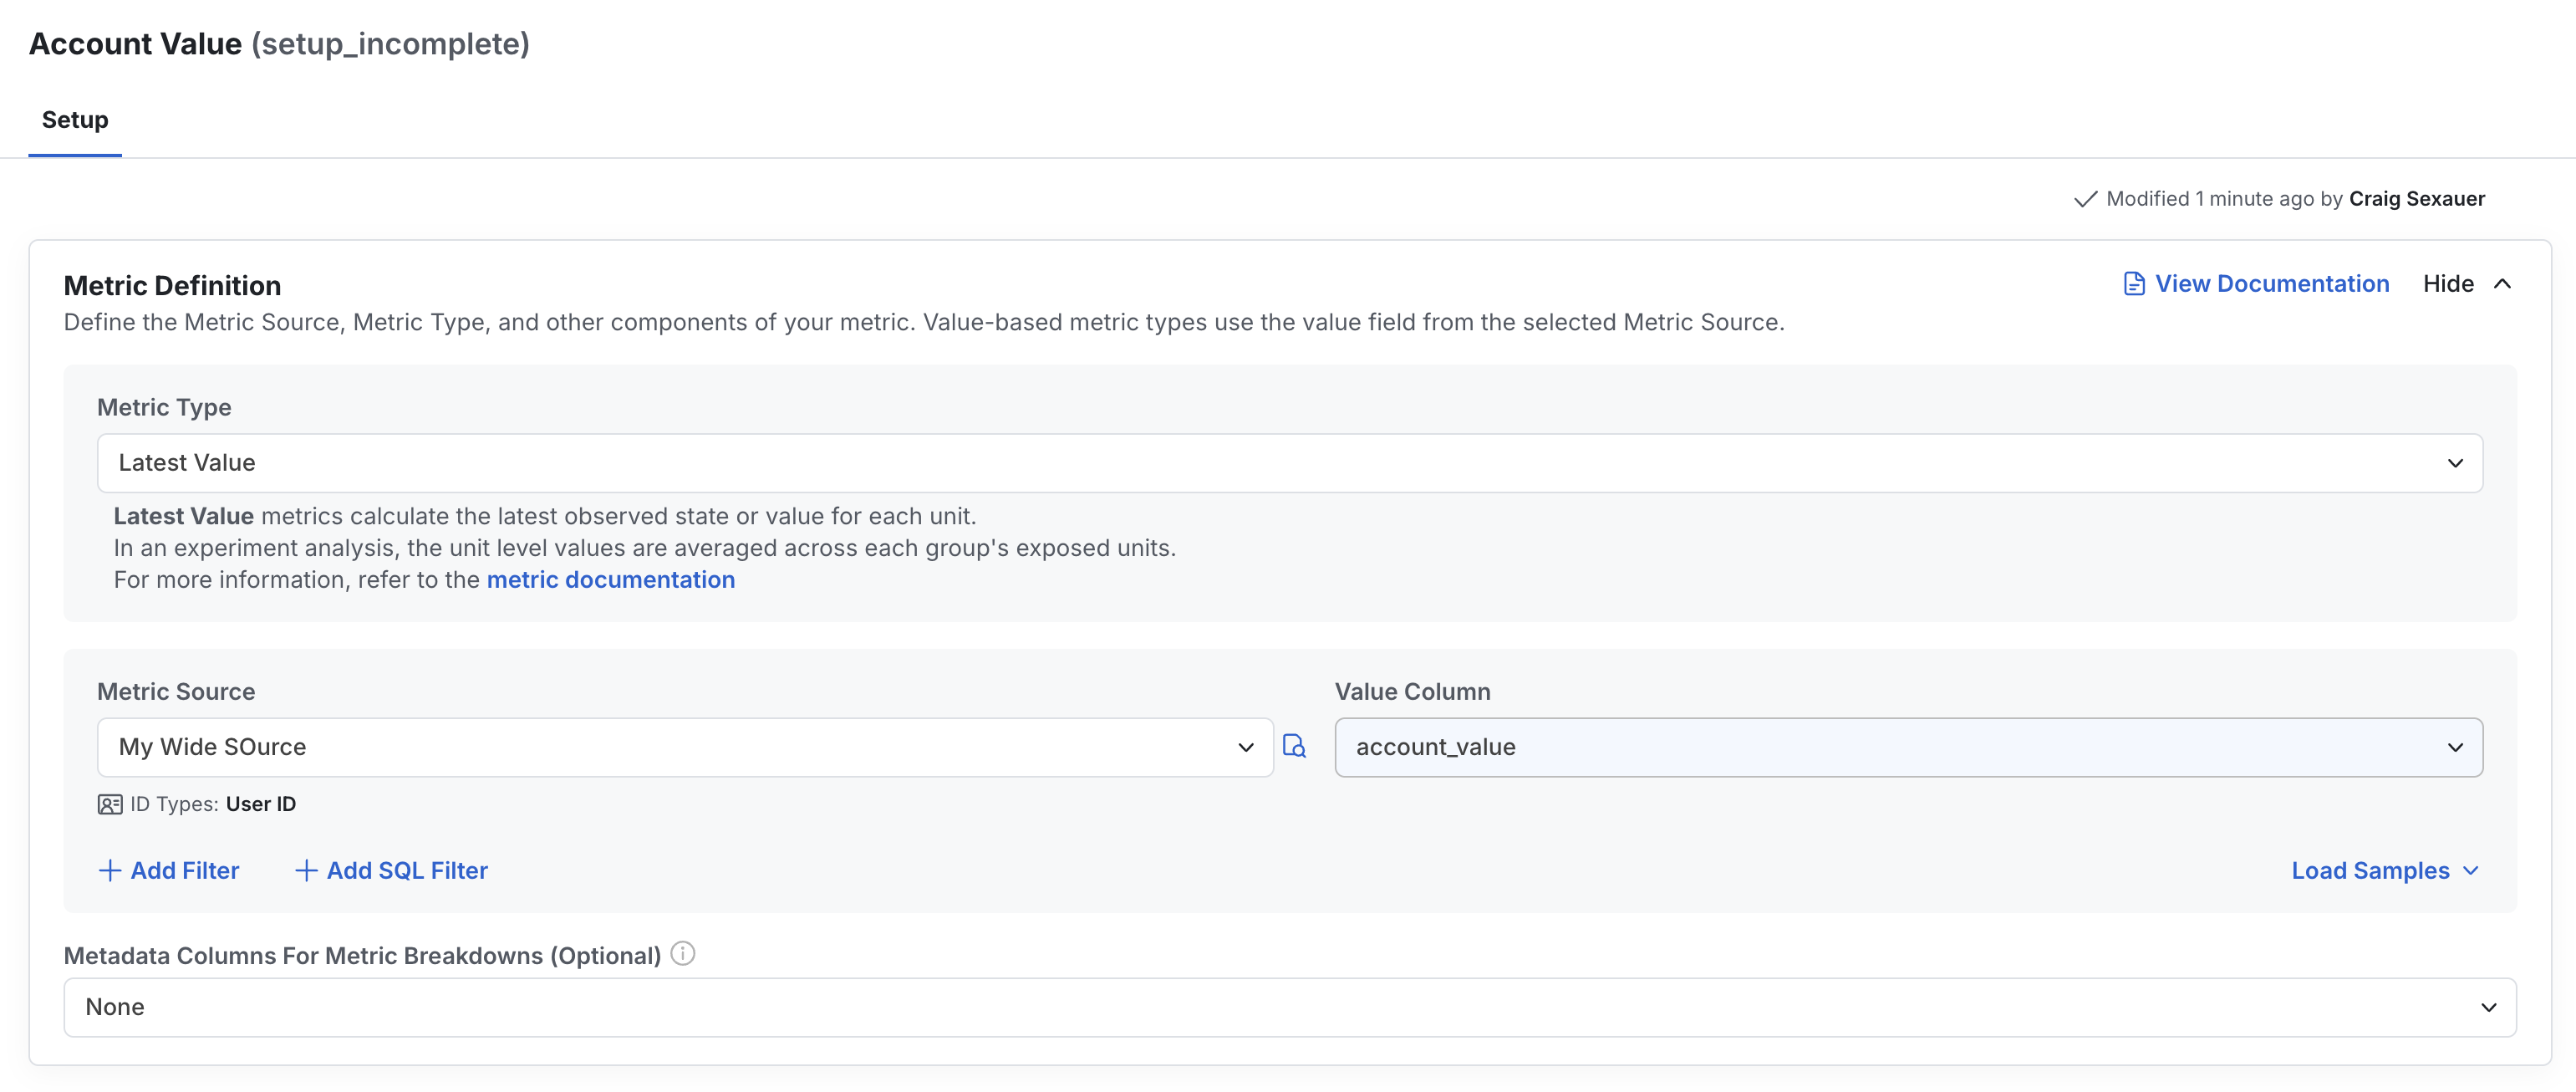
Often, you will want to understand if your experiment has altered the “state” of users. Let’s say you care about the current account value today on users in test vs. control of your experiment - have you helped users grow their account? On your end, you’ll just need a table or query that tracks users’ account values each day. Then, set up a metric source pointing to that table or query. Go to the metrics tab, press create, configure your metric name & source, and then configure a latest value metric on the column with the account value.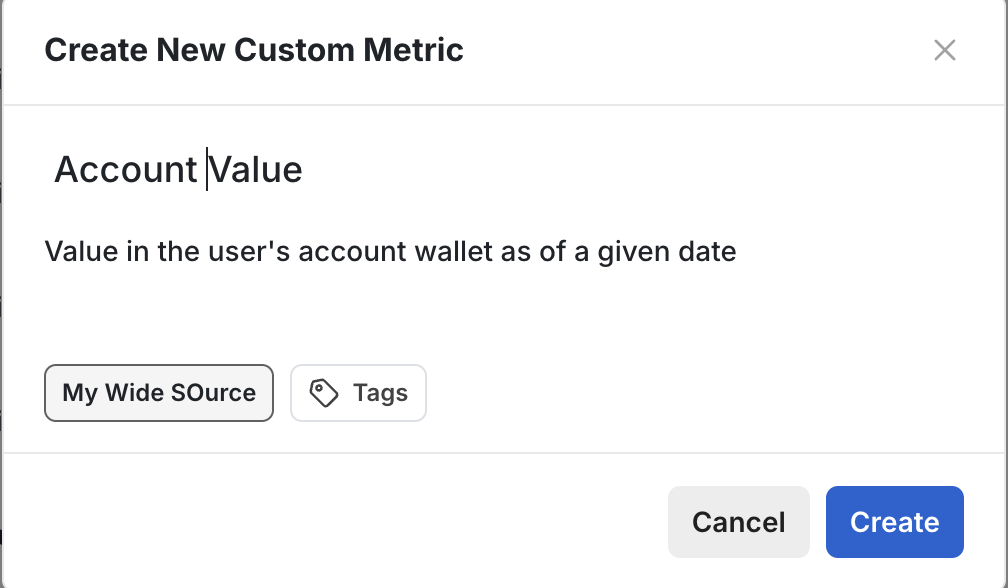
How it works in experiments
First, at unit level, Statsig calculates each day’s latest non-null value within any cohort bounds and takes the latest value from the latest day available. Then, Statsig will calculate the mean unit-level value per experiment group on each day, imputing 0s for all exposed users with no value. Statsig provides a description of this in-product for any user who wants to learn more: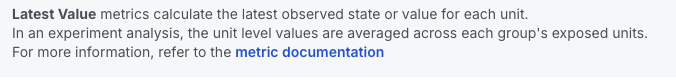
Users’ D7 Participation Rate
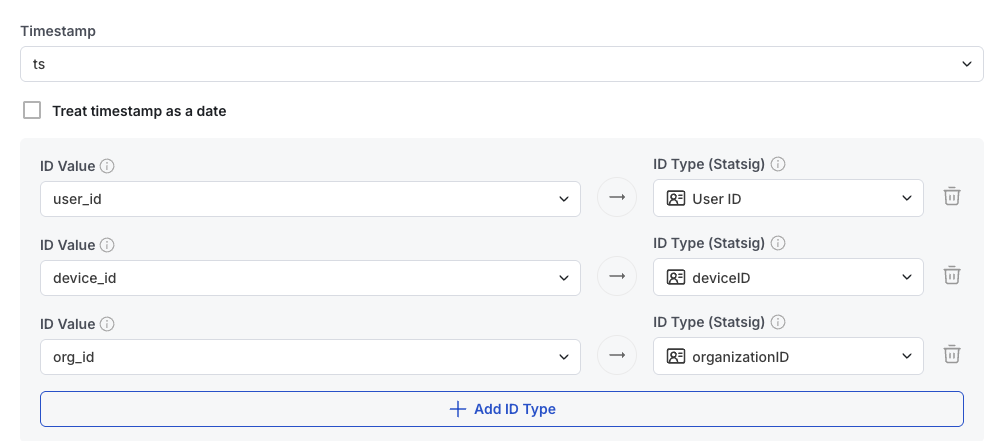
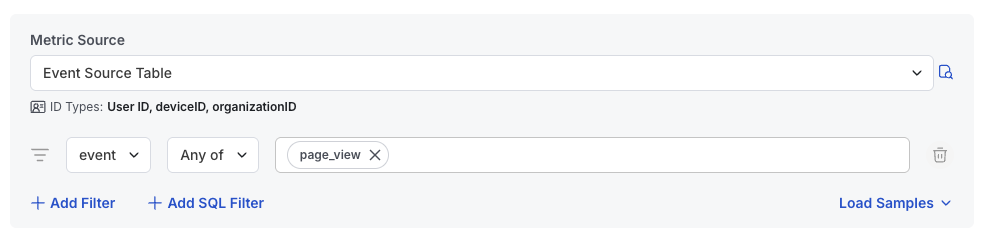
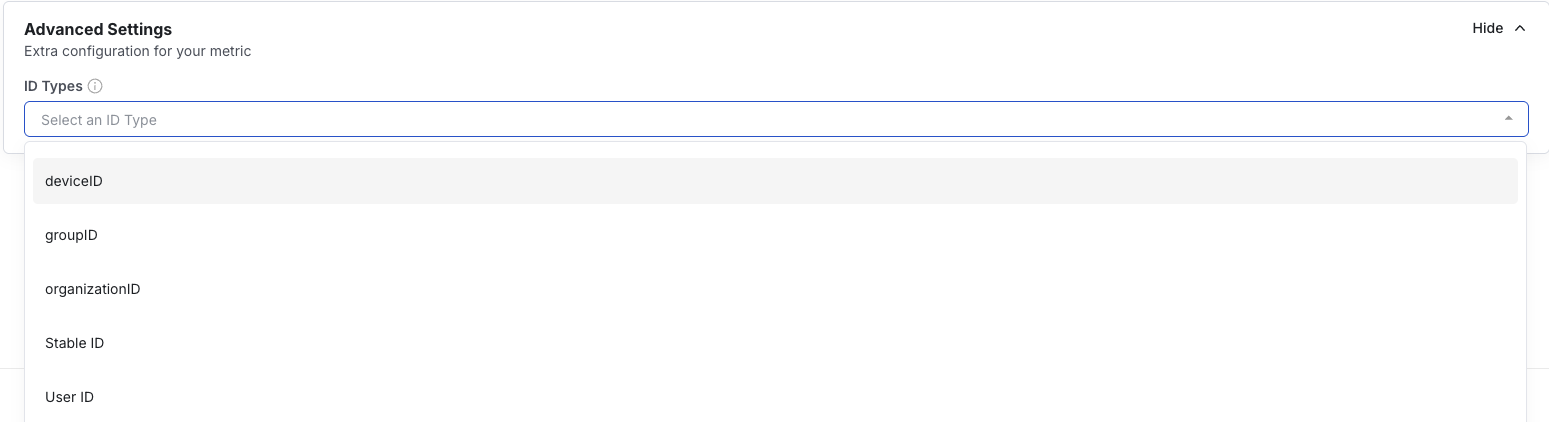
A common metric in experimentation is measuring whether exposed users take specific actions within a defined time window. On your end, you will just need to provide an event table that records user action with essential columns such as user_id, timestamp and event type. Similarly as above, configure your timestamp field and ID types.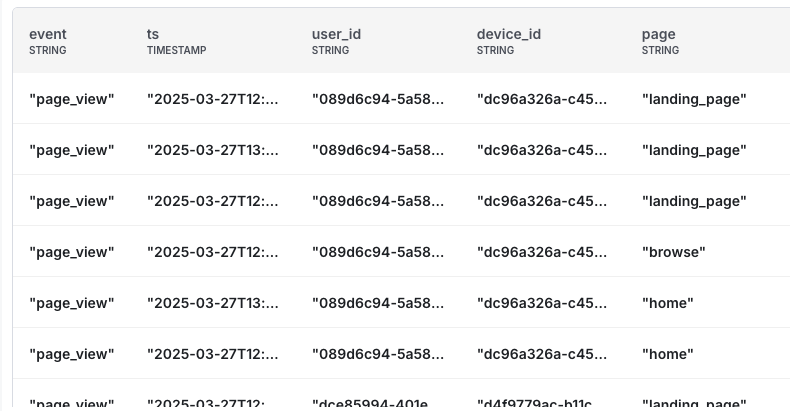
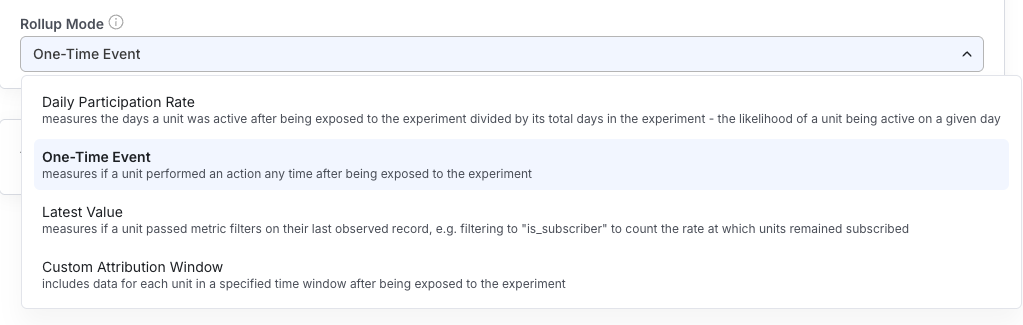
- Daily Participation Rate -> it measures the days a unit was active after being exposed to the experiment divided by its total days in the experiments
- On-Time Event -> it measures if a unit performed an action any time after being exposed to the experiment
- Latest Value -> it measures if a unit passed metric filters on their last observed record
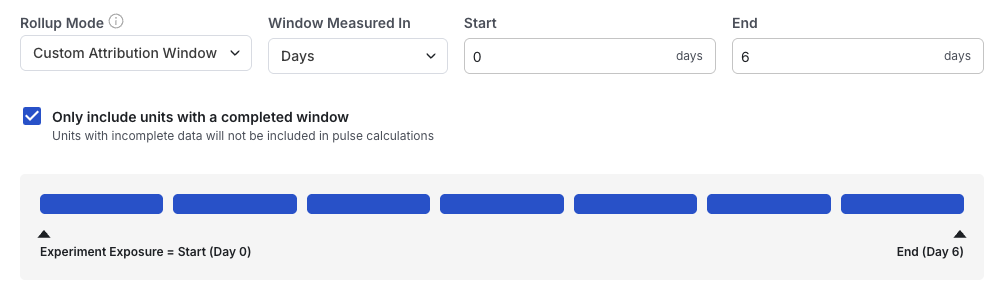
- Custom Attribution Window -> to include data for each unit in a specified time window after being exposed to the experiment
How it works in experiments
First, at unit level, Statsig will create a 0/1 flag if the event is triggered during the specified time window. Then, at the group level, the mean is calculated as the SUM of the unit-level flags, divided by the count of UNIQUE UNITS exposed to the experiment. Statsig provides documentation of this for any user who wants to learn more: https://docs.statsig.com/statsig-warehouse-native/metrics/unit-count-windowUser Funnel Metric
A common analysis in experimentation is understanding how a new feature impacts dropoff rates at each step of a user funnel. To create a funnel metric in Statsig, you need an event table that records each step of the events you want to track. The setup for your metric source follows the same process as described earlier. When you navigate to the metric catalog, select ‘Funnel’ as your metric type. Choose the unit level for your funnel steps – this can be a distinct count of users or sessions based on what you want to measure.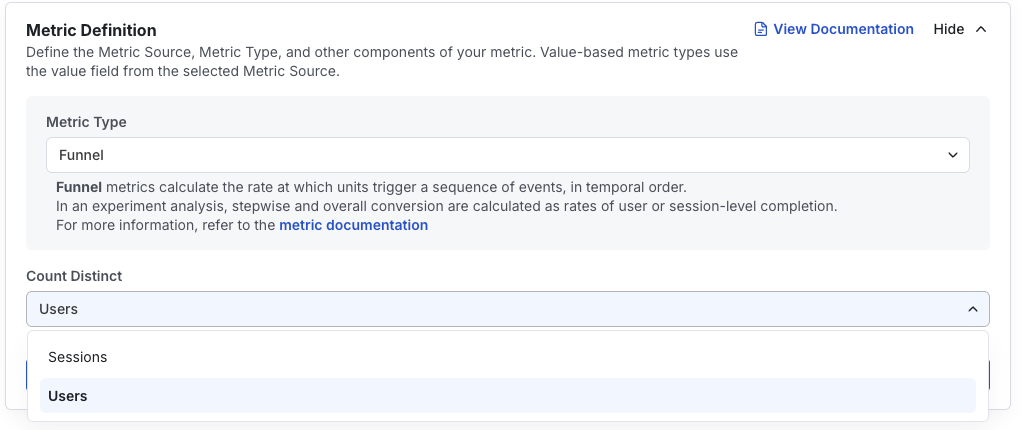
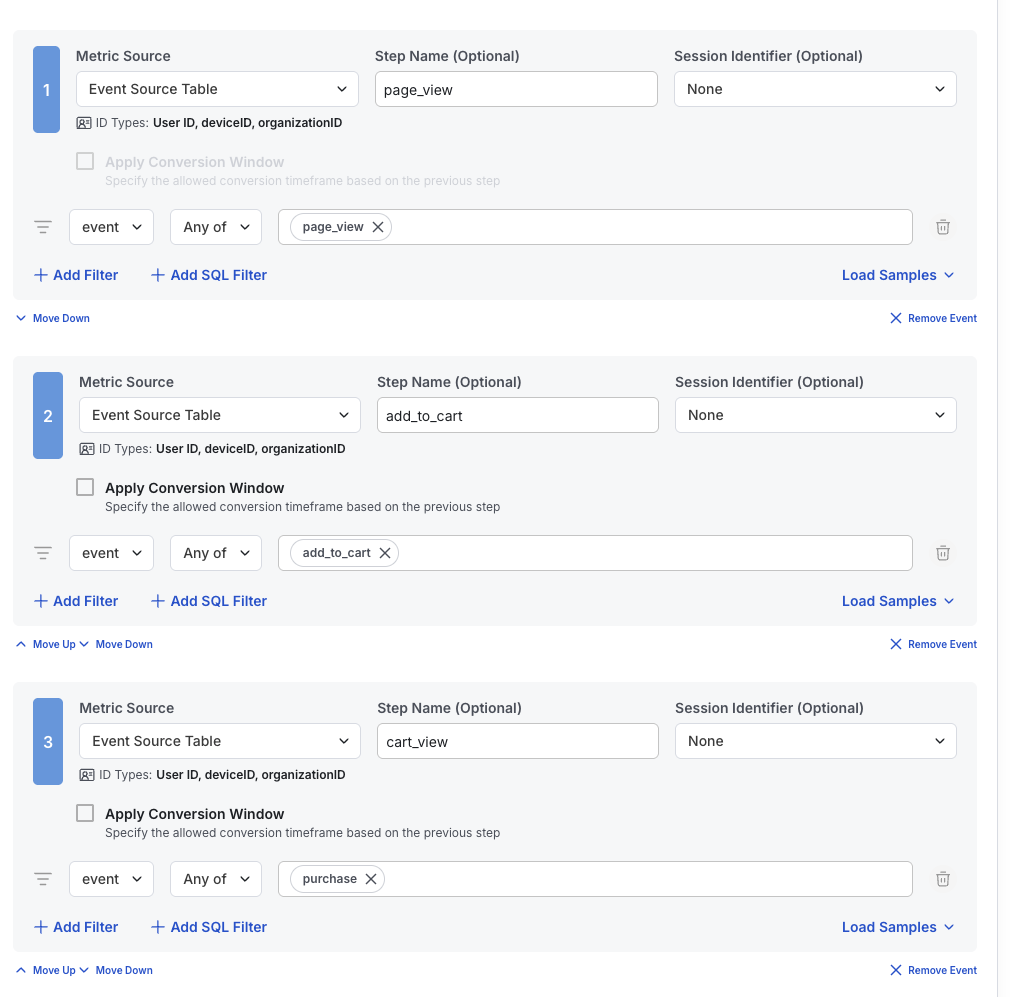
How it works in experiments
First, at unit level, a 1/0 (or session-count number for session funnels) metric is constructed for each step of the funnel. This flag is 1 if the unit completed that step some time after all previous steps were completed in order. If using a session-level funnel, it’s the number of sessions where that is true, e.g. all previous steps were completed in order for that session key. Then, at the group level, the stepwise mean is calculated as the total of each step’s metric divided by the total metric from the previous step. The overall mean is calculated as the units/sessions that completed the funnel divided by the unit/sessions that started the funnel. Statsig provides a description of this in-product for any user who wants to learn more:
User Retention Rate
A retention metric is a great way to measure changes in user stickiness and product growth with the new feature you’ve built. To create a retention metric in Statsig, you’ll need an event table that captures the key activities indicating user retention. The setup for your metric source follows the same process as described earlier. When you navigate to the metric catalog, select ‘Retention’ as your metric type. Configure the retention period and look back window. For example, if you set your ‘Retention Period End’ to be 14 and retention lookback window to be 7, retention is measured as whether the user has triggered the retention event between day 8 and day 14.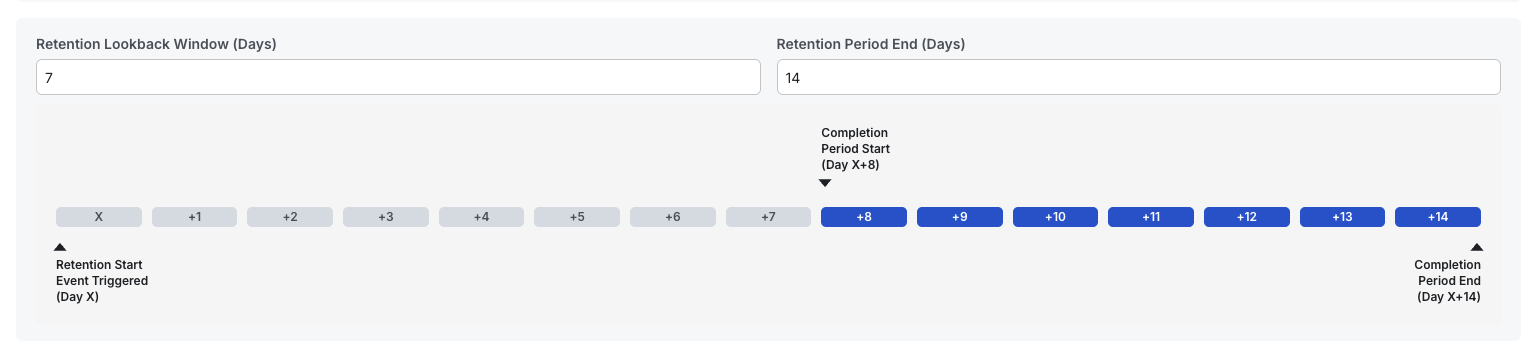
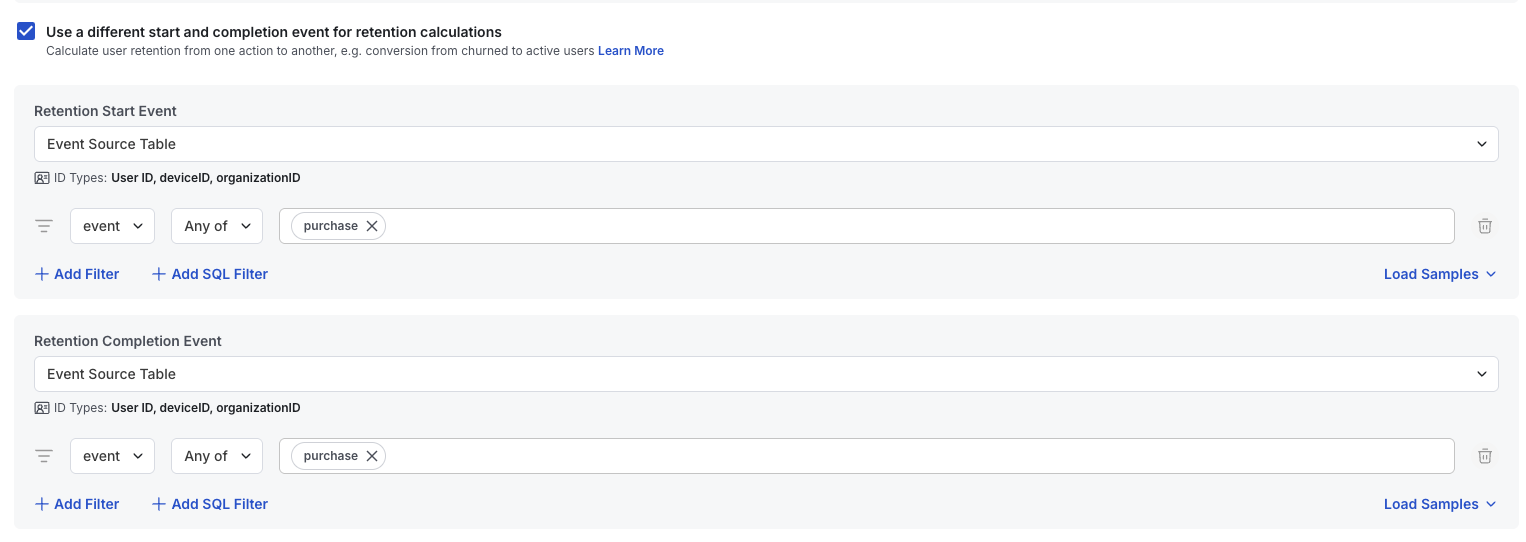
How it works in experiments
First, for each unit per day, Statsig checks if the retention start event is triggered and assigns a 0/1 flag, which serves as the denominator of the calculation. Next, Statsig checks if the retention completion event occurs within the specified time window and assigns a 0/1 flag, which serves as the numerator of the calculation. Finally, at the group level, retention is calculated as sum(numerator) / sum(denominator) to determine the overall retention rate. Statsig provides a description of this in-product for any user who wants to learn more: